

Project information
- Category: Python Skillset
- Description: Midterm Project Course
- Project date: March, 2020
- Project URL: Github
Data regression analysis of coronavirus active cases and total deaths in 9 countries.
Coronavirus disease (COVID-19) is an infectious disease caused by the SARS-CoV-2 virus. Regression approach analysis was used to describe the growth of active cases and total deaths due to coronavirus in 9 countries.
Python Skillset:- Basic: data cleaning and preparation (Numpy, Pandas, Matplotlib).
- Intermediate: Exploratory Data Analysis/Visualization.
- Advanced: regression analysis, correlation analysis.
- Data acquisition
- Data visualization
- Exploratory Data Analysis/Visualization
- Data storytelling
Tools: Jupyter Notebook
Data from the first case (day 0) in every country to March 26 2020 (The first cases in each country started on different dates).
Data from site worldometer.
Data Active Cases and Total Deaths in Amerika Serikat, Australia, Indonesia, Iran, Italia, Jerman, Korea Selatan, Spanyol, Tiongkok.


Tools: Jupyter Notebook
Visualize Data Plot
Tools: Jupyter Notebook
Analyze dan visualize exponential, quadrat, and polinomial regression equation with correlation coefficient.
Search best correlation coefficient.
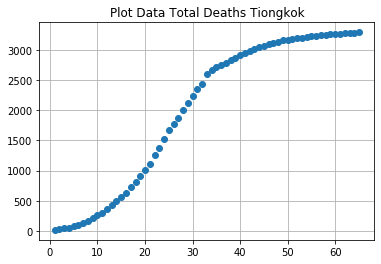
Tiongkok: Growth Active Cases (quadrat and polinomial regression equation with orde 6th), Decay Active Cases (exponential and polinomial regression equation with orde 5th), Total Deaths (quadrat and polinomial regression equation with orde 5th).
China was the first country with positive for the Covid-19 virus. On the 1st day, there were 554 Active Cases, while the total deaths were only 17 cases. Researcher continues conducted research on the new virus and was able to identify it on day 6 (a week from the first case). The spread of the virus continues to increase because China is the most large population in the world. Then, the government adopted a lockdown and screening policy starting at the end January. Therefore, the Active Cases that occurred in China experienced a turning point on the 28th day, February 18 2020. Apart from that, the number of deaths per day as well decreased after the policy was implemented.
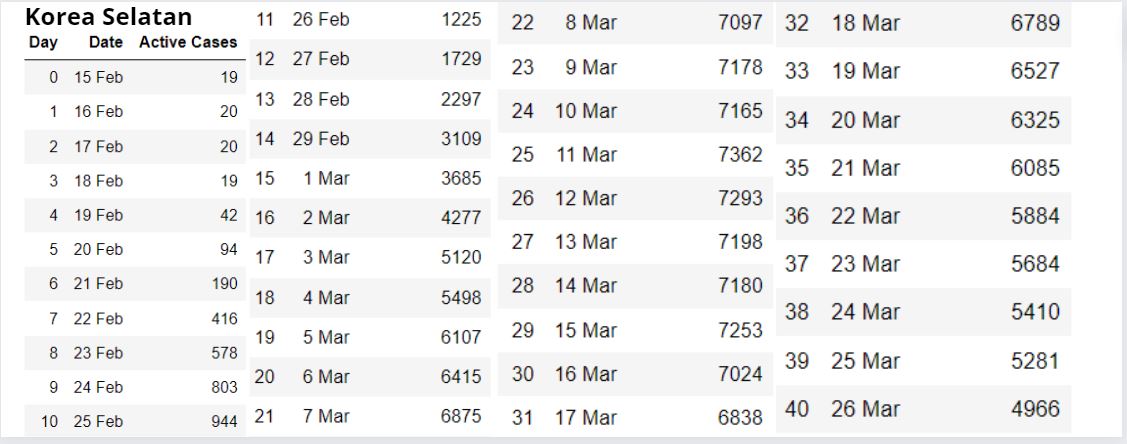
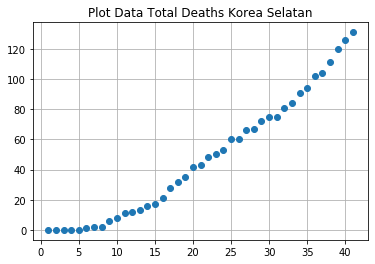
Korea Selatan: Growth Active Cases (quadrat and polinomial regression equation with orde 6th), Decay Active Cases (exponential and polinomial regression equation with orde 5th), Total Deaths (quadrat and polinomial regression equation with orde 5th).
South Korea did not implement a lockdown policy, but did mass testing since the end of February, social distancing since March 21 2020, and data collection to prevent people who have not been infected from contracting the Covid virus in red zones. Therefore, the Active Cases that occurred in South Korea experienced a turning point on the 26th day, March 12 2020. The number of deaths in Korea is relatively small compared to other countries because the population over 65 years old is small, only around 4-5%. Although Active cases are quite high due to population density.
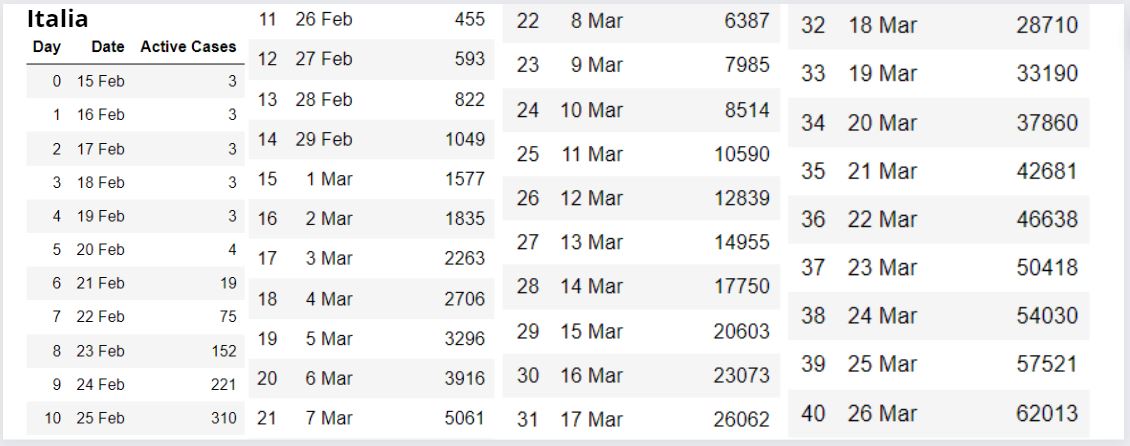
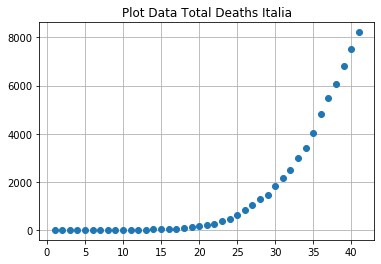
Italia: Growth Active Cases (quadrat and polinomial regression equation with orde 5th), Total Deaths (quadrat and polinomial regression equation with orde 5th).
Italy is experienced very high cases of both Active Cases and Total Deaths. This is because 23% of the population is over 65 years old. Italy just went into lockdown on March 24, so that on March 26 cases were still increasing.
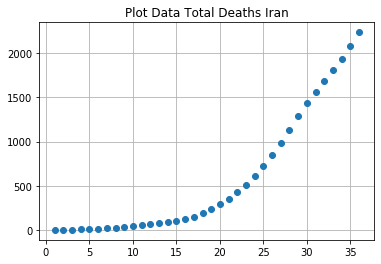
Iran: Growth Active Cases (quadrat and polinomial regression equation with orde 5th), Total Deaths (exponential and polinomial regression equation with orde 5th).
Iran is implement a social distancing policy, spraying public facilities and places, however did not implement a lockdown until March 24 after the number of deaths occurred high every day.
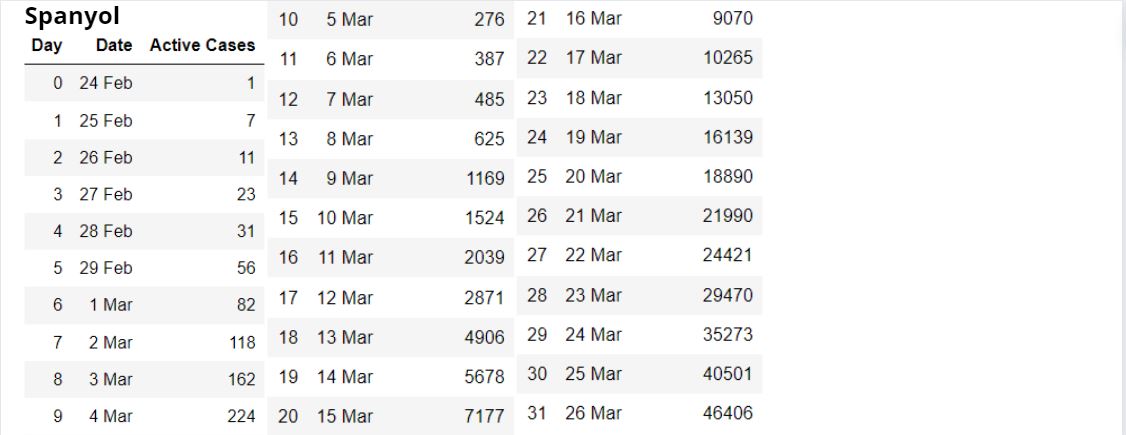
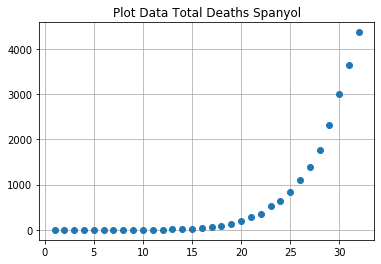
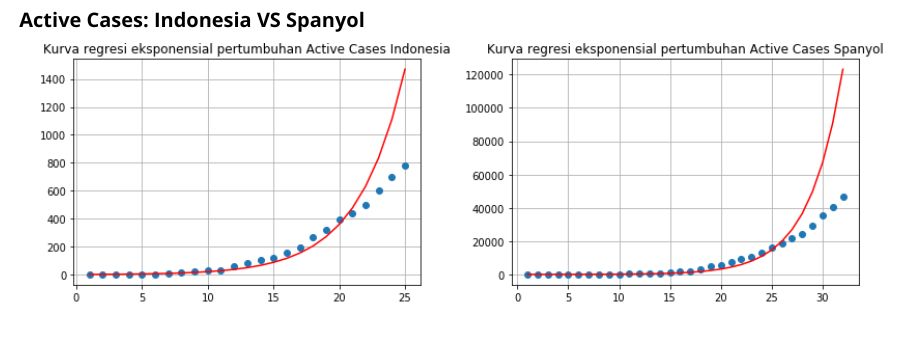
Spanyol: Growth Active Cases (exponential and polinomial regression equation with orde 6th), Total Deaths (quadrat and polinomial regression equation with orde 6th).
The increase in Covid-19 cases from day 0 to March 8 was relatively small both in terms of Active Cases and Total Deaths. However, on March 8 there was several demonstrations in Spain. After that, the number of cases increased quite high, so that on date March 12, lockdown was implemented. However, cases have not decreased until March 26 2020.
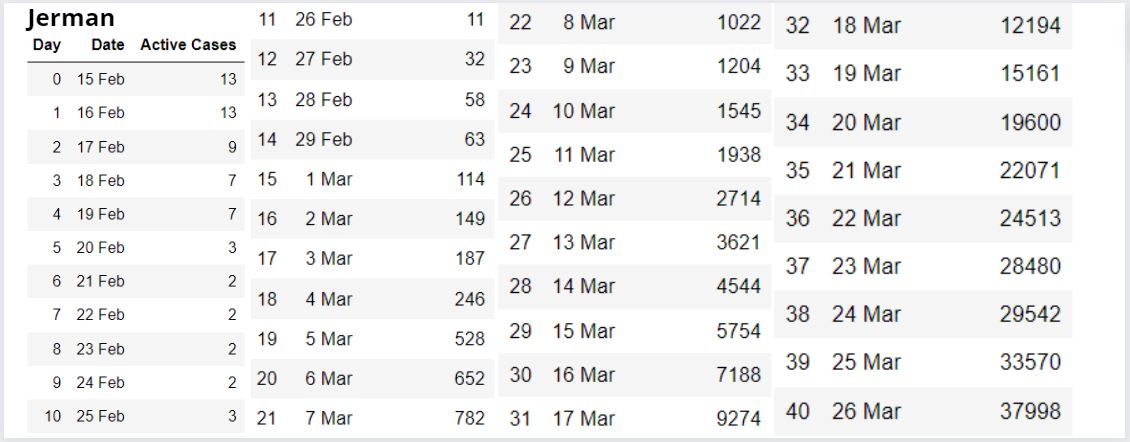
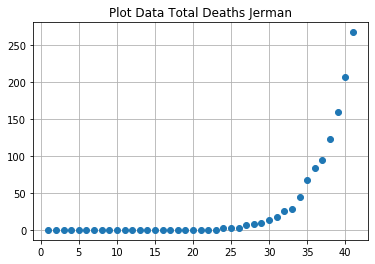
Jerman: Growth Active Cases (exponential and polinomial regression equation with orde 5th), Total Deaths (quadrat and polinomial regression equation with orde 5th).
Active cases in Germany are high, but total deaths are low (0.18%). Because of the government Germany moved quickly to carry out initial testing and then quarantine those who tested positive Covid-19, and better medical equipment. In addition, the majority of residents are over 60 years old, but most of those infected are aged 20-50 years.
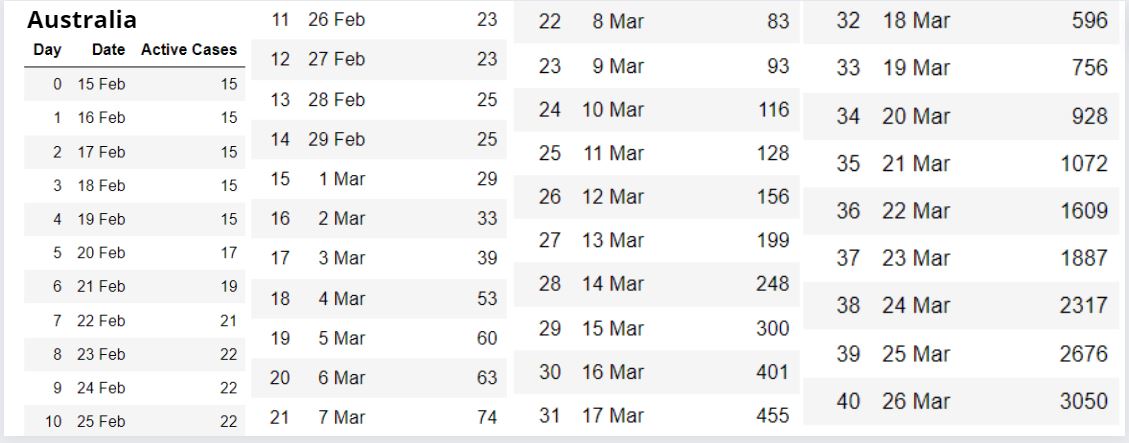
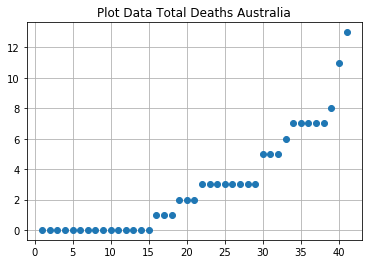
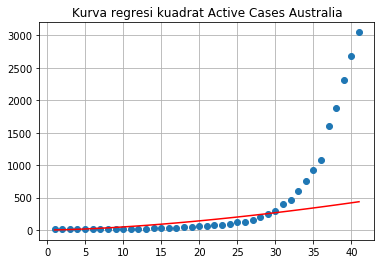
Australia: Growth Active Cases (exponential and polinomial regression equation with orde 5th), Total Deaths (quadrat and polinomial regression equation with orde 5th).
Active Cases and Total deaths in Australia are relatively low. This is because the country of Australia has quite a large area although it has a large population, resulting in density of the population is low. Apart from that, in Australia there is also a local lockdown.
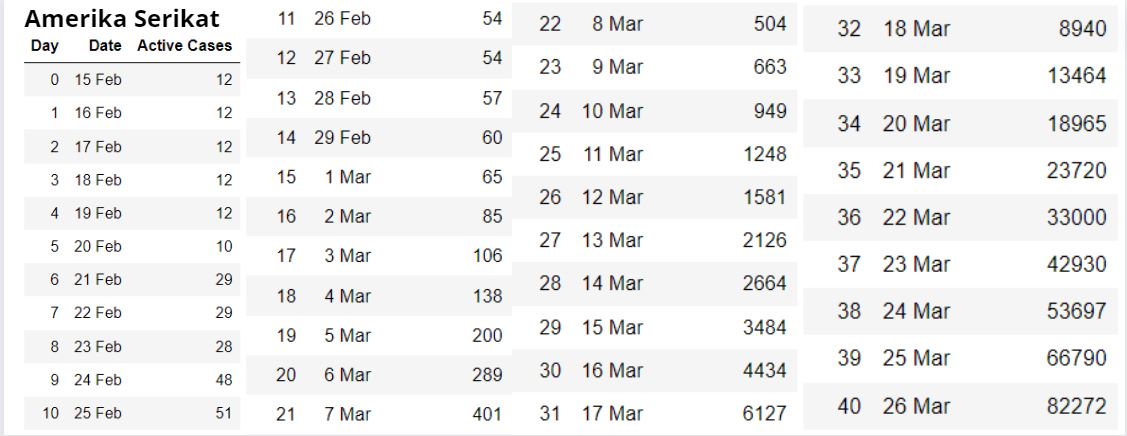
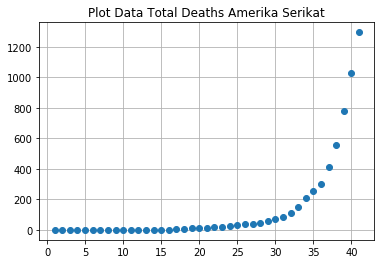
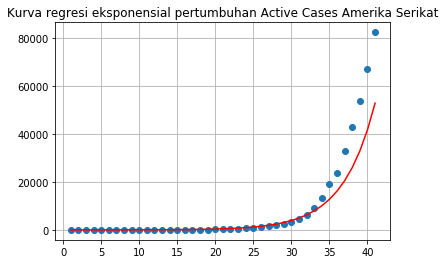
Amerika Serikat: Growth Active Cases (exponential and polinomial regression equation with orde 5th), Total Deaths (exponential and polinomial regression equation with orde 5th).
Cases in the United States are very high due to several factors. These factors including failed social distancing policies, limited PPE, and late lab testing.
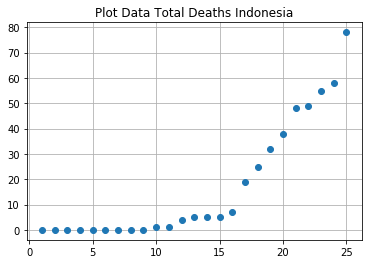
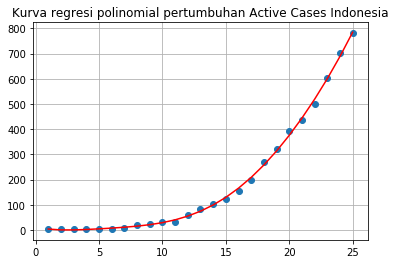
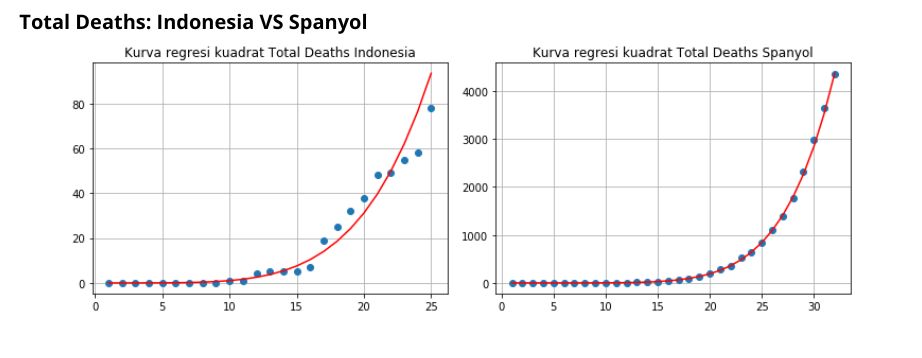
Indonesia: Growth Active Cases (exponential and polinomial regression equation with orde 6th), Total Deaths (quadrat and polinomial regression equation with orde 6th).
Active Cases in Indonesia are increasing exponentially, while Total Deaths are increasing quadratically. In fact, Indonesia is the country that was recently infected with Covid-19, Indonesia should have taken greater anticipation. This increase is due to infection testing is still small. Apart from that, Indonesia did not impose a lockdown and lack of handling. So the recovery rate in Indonesia is small, while the level high mortality.
The regression approach that is closest to the growth of Active Cases in Indonesia is exponential with the equation y = 1.2898e0.2815x. Then, the closest regression approach to Total Deaths in Indonesia is quadratic with the equation y = 0.00001x4.9203. Based on the data analysis and regression approach, Spain also has the same regression curve approach, for the growth of Active Cases is exponential with the equation y = 7.3809e0.3038x. Whereas for Total Deaths approached by quadratic with the equation y = 0.0000004x6.6710. Therefore, Spain is most similar to the situation in Indonesia for Active Cases and Total Deaths due to coronavirus.
NB: The images above are just a few sample plots.