

Project information
- Category: Big Data Skillset
- Description: Final Assignment Course
- Project date: December, 2022
- Project URL: Github
Design data schema and analyze SQL query from business process and key performance indicator of PT. Indofood Sukses Makmur Tbk
PT. Indofood Sukses Makmur Tbk is a company engaged in the food or beverage which was founded in 1990 with PT. Panganjaya Intikusuma.
Big Data Skillset:- Analyze business process and key performance indicator of company.
- Design and build database schema.
- Perform query for data analytics.
- Analyze business process
- Analyze Key Performance Indicator
- Design database schema
- Perform Query
- Data storytelling
Vision: A Total Food Solution Company
Missions: To provide sustainable solutions for food needs, To continuously improve our people, processes and technologies, To contribute to the welfare of the society and environment in a sustainable manner, To continuously improve stakeholder values
Values: “With discipline as the basis of our way of life;
We conduct our business with integrity;
We treat our stakeholders with respect; and
together we unite to strive for excellence and continuous innovation.”
Business Groups: Consumer Branded Products (CBP), Bogasari, Agribusiness, and Distribution
Performance that measure by data analyst in Indofood perform by report and trend of sales analysis (by volume, by area, by distributor). Therefore, we can know that Key Performance Indicators from the Indofood Company are related to sales data as seen from financial perspective, customer perspective, internal business perspective, and learning and growth perspective.
Financial: Operating Income, percentage of sales to profit
Customer: Customer Retention, a metric that measures customer loyalty; On Time Delivery, percentage of on time delivery order; Number of Complaints, the amount of consumer's complaint; Sales Return, the amount of consumer's return; Costumer acquisition, compare the amount of new customers with all customers.
Internal business: Supplier Lead Time, average time to distributor deliver order.
Learning and Growth: Employee Productivity, operating income divide by the amount of employee.
Tools: Draw.io
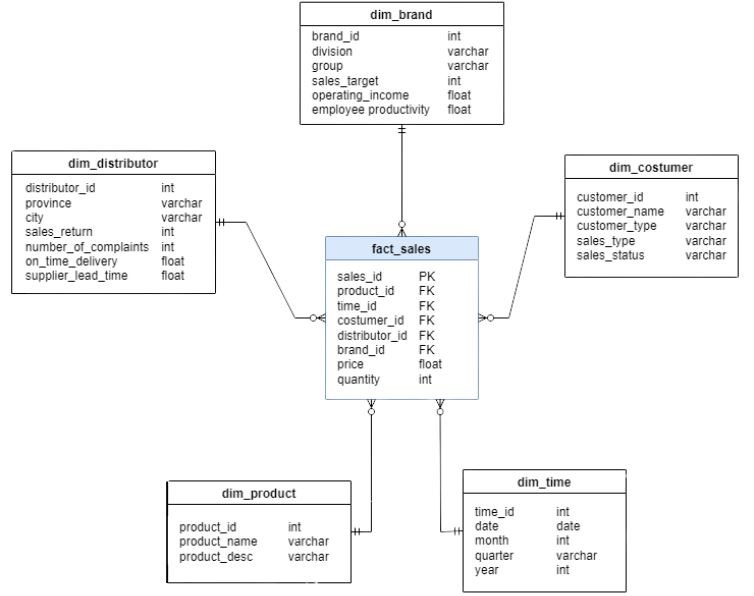
Report and trend of sales analysis require data input from various sources party in the company. Sales is process that includes distribution activities, services selling to buyers, and handling technical and non-technical complaints. Data that needed for detailed analysis are product, time, customer, distributor, and brand as a dimension table of the sales fact table.
Tools: SQL
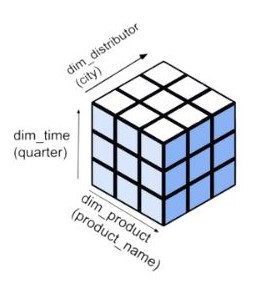
SELECT product_name as product, quarter, city, SUM(quantity) as “sales_total”
FROM dim_product, dim_time, dim_distributor
GROUP BY CUBE (product, quarter, city)
ORDER BY product;
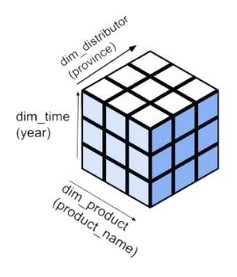
ROLL UP
SELECT product_name as product, year, province, SUM(quantity) as “sales_total”
FROM dim_product, dim_time, dim_distributor
GROUP BY CUBE (product, year, province)
ORDER BY product
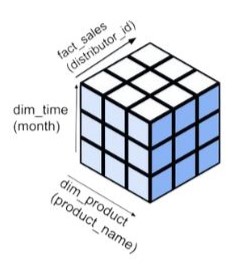
DRILL DOWN
SELECT product_name as product, month, distributor_id, SUM(quantity) as “sales_total”
FROM dim_product, dim_time, fact_sales
GROUP BY CUBE (product, month, distributor_id)
ORDER BY product
SLICE & DICE
SELECT product_name as product, quarter, city,
SUM(quantity) as “sales_total”
FROM dim_product, dim_time, dim_distributor
WHERE product = ”Indomie” , city = “Magelang” or “Semarang”
GROUP BY (product, quarter, city)
ORDER BY quarter
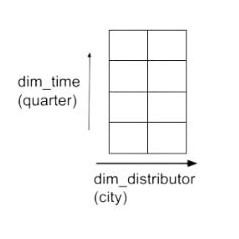
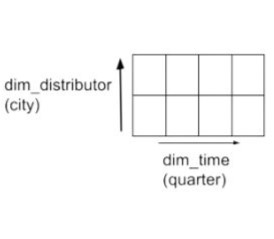
PIVOT
SELECT product_name as product, city, quarter
SUM(quantity) as “sales_total”
FROM dim_product, dim_time, dim_distributor
WHERE product = ”Indomie” , city = “Magelang” or “Semarang”
GROUP BY (product, city, quarter) ORDER BY city
Operating Income each brand can be obtained from an OLAP query on price data and sales quantity at each distributor within a certain time span operated by reducing the initial calculation of capital.
Customer Retention can be obtained from OLAP queries by comparing customer data in each time period. This can identify whether the company can retain customers or not.
On Time Delivery can be obtained from time data and order status to measure the percentage of orders on time.
Number Complaints each brand can be obtained by querying OLAP data on the number of complaints taken at a certain time span at each distributor who directly interacts with customers.
Sales Return each brand can be obtained by OLAP query data on order returns taken at certain time intervals at each distributor who directly interacts with customers.
Customer Acquisition can be obtained from OLAP queries by comparing customer data in each time period. This can identify whether the company can get new customers or not.
Supplier Lead Time can be obtained from time and order status data to measure the average time to complete orders.
Employee Productivity can be obtained from operating income data by calculating the total number of employees.